Data Science and Analysis for Schizophrenia Treatment
Project Technical Report
As part of the Stanford STATS 202: Data Mining and Analysis course, I pursued a project that involves the analysis of patients suffering from a mental disorder known as Schizophrenia. The severity of the disease is often measured using a metric known as the PANSS (Positive and Negative Syndrome Scale) score. This scale splits the symptoms into three main categories or groups, P (Positive), N (Negative), and G (General) - each measuring a different type of symptom (e.g. P may be closely related to overexcitement, hallucinations, whereas N is related to emotional withdrawal). The ranges of each group are: P1-P7, N1-N7, and G1-G16, each of which has a value between 0 and 7 (0 indicating an absence of the symptom, whereas 7 indicating the prominence of the symptom). The goal of the project is to analyze the effectiveness of a new experimental drug in the treatment of schizophrenia given a large database of patient treatment information.
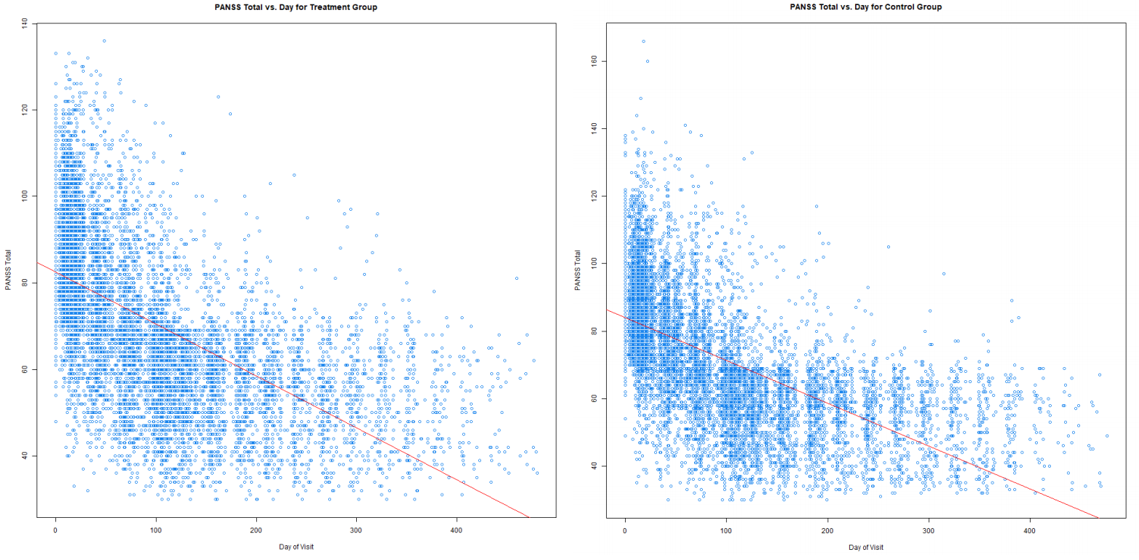
Firstly, to assess the general effectiveness of the treatment, we can simply perform a correlation analysis between the PANSS score and the day of visit. Given the treatment is effective, we expect the PANSS score to drop (i.e. symptoms become less severe) over time. However, care must be taken when performing such an analysis. The dataset provides two populations during the treatment, the treatment group (i.e. the group which are given the experimental drug), and the control group (i.e. the group given off-the-shelf, medically accepted drug). The statement we can make is, only if the performance of the experimental drug is more effective than what is already widely available in the market should this drug be considered for widespread market usage. From the performance comparison below, we can see that the treatment and control group has more or less a similar performance in reducing patient PANSS score.
Another challenge provided is to perform binary classification of unreliable treatment data via a supervised learning approach from the data provided. To do this, I initially performed model selection, choosing between random forests, gradient boosting, and neural networks; first fine-tuning each model via cross-validation, before validating on the test set. The best performing model was gradient boosting, achieving an accuracy of greater than 90% in predicting reliable vs. unreliable treatment data, as well as a superior precision and recall.
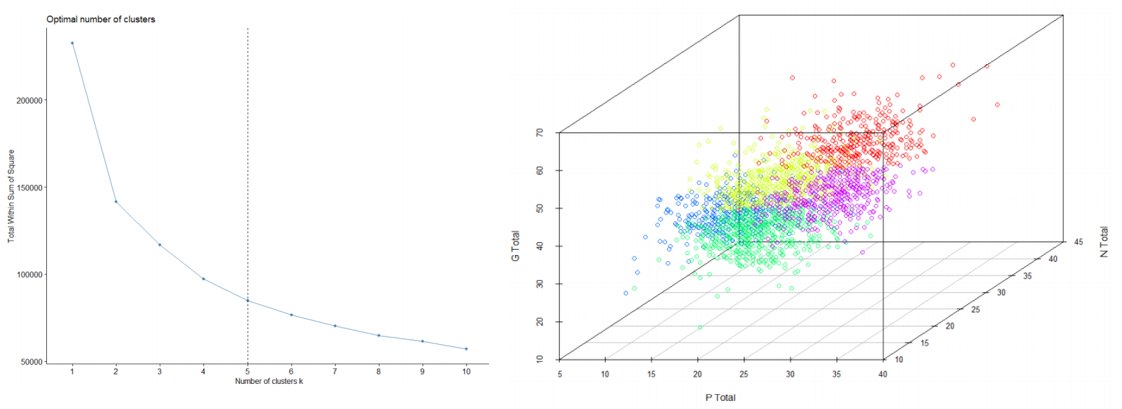
The next challenge was to identify patients suffering from similar schizophrenia symptoms. To do this, I used two approaches. The first was treating each symptom group (P, N, and G) as 3 separate dimensions by aggregating the values from each group, and performing K-means clustering (with the elbow method) directly to the 3-dimensional dataset. The result is shown below:
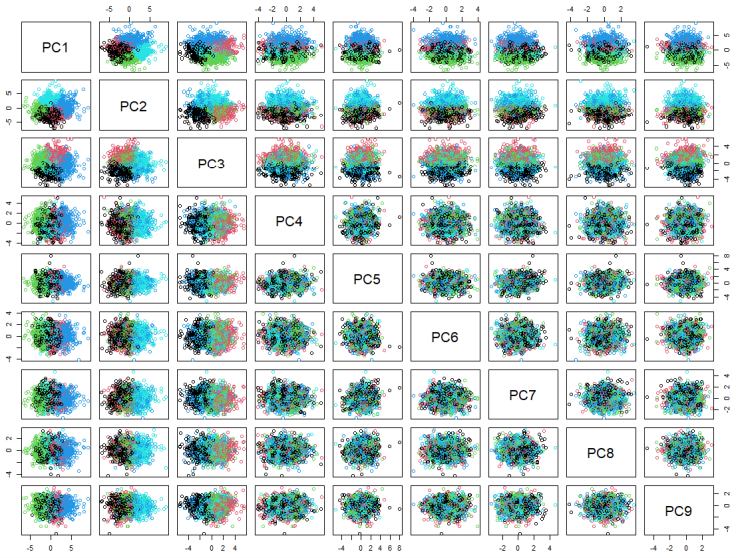
However, it is important to note that it is rather facile to treat the categories of each group (e.g. P1, P2, ..., P7) as a single dimension and aggregating their values, because each subcategory corresponds to its own type of symptom (e.g. P1 may be hallucination, P2 may be overexcitement). Thus, it is more appropriate to treat our dataset as a 30-dimensional space (7 P's, 7 N's, 16 G's). Before performing the clustering, it is crucial to reduce the dimensionality of the dataset, making the model less sparse. To do this, I used PCA (Principal Component Analysis), taking the principal components which contains 60% of the explained variance (or information) of our dataset. After this step, I applied the k-means clustering to achieve a more powerful clustering result. The detailed implication of the clustering can be viewed in the technical report. Below shows the visualization of the clustering on the 9 principal components.
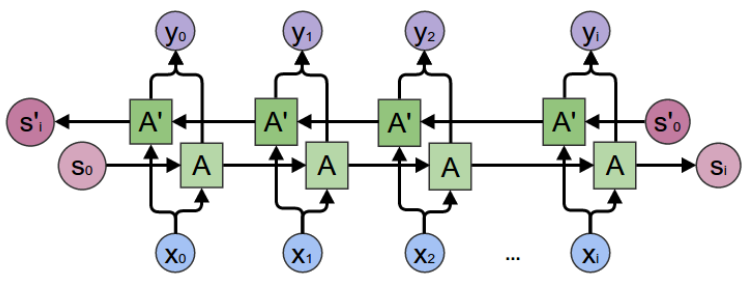
The final challenge, and perhaps the most difficult one, is to create a timeseries model to predict a new patient's PANSS score trajectory given their initial PANSS score before any treatment. There are various algorithms to perform timeseries modelling; however, the most effective that I successfully tested was the bi-directional recurrent neural network. Recurrent neural networks are ML models that are able to capture sequential data through the use of hidden states (as a form of memory). Bidirectional neural networks are effectively splits RNNs into two directions, forward and backward. In other words, instead of simply a model that is able to predict the future PANSS score given the past PANSS scores, the model is also reinforced to be able to predict the past PANSS score given the future PANSS score (i.e. moving backwards). The architecture of the bidirectional RNN is shown below: